
Example: GARCH Model in TSMT
The volatility of financial time series data is often serially correlated, such that there are often periods of sustained high volatility and other periods of sustained low volatility. This time-varying volatility cannot be modeled by an ARMA model, because its conditional variance given previous time periods is fixed. The error term in a generalized autoregressive conditional heteroskedastic (GARCH) model is:εt = zt σt
where, zt is a Gaussian white-noise process and σt represents the time-varying standard deviation. The conditional variance is defined as:σ2t = α0 + α1 ε2t-1 + ... + αq ε2t-q + β1 σ2t-1 + ... + βp ε2t-p
Load and plot time series
For this example, we will use a data set that comes with TSMT, named index.asc. This file contains data for several stock indexes. For our example, we will use the fourth column of index.dat which contains data for the S&P 500.
//Get path to GAUSSHOME directory
path = getGAUSSHome();

//Add file name to path
fname = path $+ "examples/index.dat";

//Load all data from 'index.dat'
y = loadd(fname);

//Extract all observations from the 4th column of 'y'
y = y[.,4];

//Plot data
plotXY(seqa(1, 1, rows(y)), y);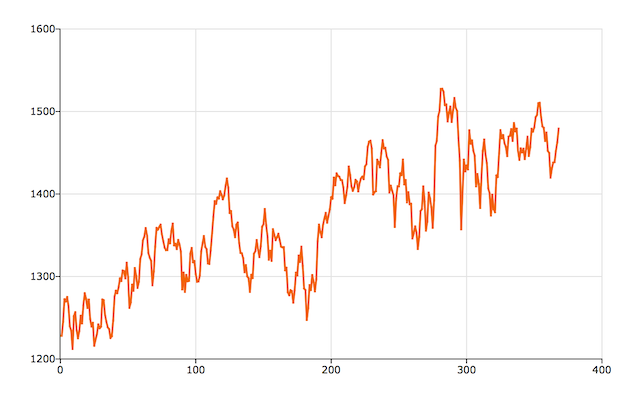
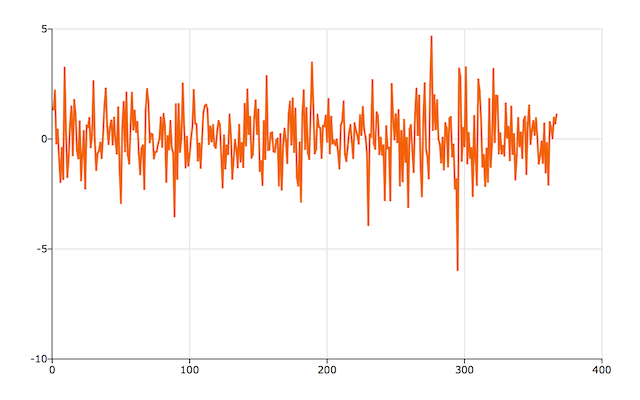
The series seems to have a trend and the mean is clearly not zero--both are as we would expect for stock data. We will transform our data by dividing y by yt-1, to get the percent change from one period to the next. Then we will take the natural log of these changes and multiply by 100 and plot the transformed data.
//Transform data
Y = 100 * ln(Y[2:rows(Y)] ./ Y[1:rows(Y)-1]);

//Plot the transformed data
plotXY(seqa(1, 1, rows(Y)), Y);
The graph of the transformed data should look like this:
Estimating the GARCH Model
The garch function is a convenient tool for estimating the parameters of a GARCH model with or without exogenous variables. The garch function takes two required arguments:- A garchControl structure.
- An N x 1 data vector, y, containing the time series.
The garchControl Structure
This structure handles the matrices and strings that control the estimation process such as the order of the GARCH parameters, the density of the error term (normal, t, skewed-t) and the type of standard errors to compute. Continuing with the example above,//Load the 'tsmt' library
library tsmt;
//Declare 'gctl' to be a garchControl structure
//and fill with default values
struct garchControl gctl;
gctl = garchControlCreate();
//Declare 'gout' to be an garchEstimation structure,
//to hold the results from 'garch'
struct garchEstimation gout;
//Specify 'p' to equal 3
gctl.p = 3;
//Specify 'q' to equal 2
gctl.q = 2;
//Specify quasi-maximum likelihood standard errors
gctl.covType = 2;Next we will estimate the GARCH model:
//Perform estimation with 'garch'
gout = garch(gctl, y);print "AIC " gout.aic;
print "BIC " gout.bic;
print "Likelihood ratio statistic " gout.lrs;AIC 1230.6670
BIC 1257.9471
Likelihood ratio statistic 1216.6670The parameters estimated by the garch function and their names are located in the par member of the gout structure. gout.par is a PV structure. We can extract the parameter estimates and names with the functions pvGetParVector and pvGetParNames. Both of these functions take a PV structure as their only input. pvGetParVector returns a vector, containing the parameter estimates, while pvGetParNames returns a string array of the parameter names. Finally, the confidence limits for the parameter estimates is contained in the climits member of gout. We can print them out like this:
//Extract parameter values
p_vals = pvGetParVector(gout.par);
//Extract parameter names
p_names = pvGetParNames(gout.par);
//Create 1x4 string array with the header information,
//using the horizontal string concatenation operator, $~.
head = "" $~ "Coefficients" $~ "lower cl" $~ "upper cl";
//Create a 'number of parameters' x 4 string array containing
//the parameter estimates and confidence intervals
body = p_names $~ ntos(p_vals ~ gout.climits);
//Print report
print head;
print body;Which should print a report like the following:
Coefficients lower cl upper cl
beta0[1,1] 0.0888445 -0.0609072 0.238596
garch[1,1] -0.0371061 -0.536383 0.462171
garch[2,1] 0.324922 -0.522362 1.17221
garch[3,1] -0.0706248 -0.561071 0.419821
arch[1,1] 0.0225148 -0.0535612 0.0985909
arch[2,1] 0.22144 -0.0770541 0.519934
omega[1,1] 0.952287 -1.67306 3.57763Statistical inference
The usual method for statistical inference, comprising the calculation of the covariance matrix of the parameters and constructing t-statistics from the standard errors of the parameters, fails in the context of inequality constrained parameters because confidence regions will not generally be symmetric about the estimates. For this reason garch computes and reports confidence limits, rather than t-statistics.
However, if we would like to calculate the standard errors of the parameters and t-statistics, the garchEstimation structure contains the information that we need. The moment member of the garchEstimation structure contains the covariance matrix of the parameters. Since we set the covPar member of the garchControl structure to compute QML standard errors, the gout.moment contains the Quasi-ML covariance matrix of the parameters, which is defined as:
CQML = S-1 M S-1
where S is the Hessian and M is the cross-product of the derivatives of the parameters by observation. The Quasi-ML covariance matrix is generally preferred, because it is robust to model misspecification.
//The standard errors of the parameters are
//equal to the square root of the diagonal of the 'moment' member
std_err = sqrt(diag(gout.moment));
//Calculate t-statistics
t_stat = p_vals ./ std_err;
//Create header string using horizontal
//string concatenation operator
head = "Parameters" $~ "Std. Err" $~ "T-stat";
//Create data table by:
// 1) Concatenating each vector with the ~ operator
// 2) Converting the matrix to a string with 'ntos'
data_tbl = ntos(p_vals ~ std_err ~ t_stat);
//Print the output
print "";
print head;
print data_tbl;
which should produce the following output:
Parameters Std. Err T-stat
0.0888445 0.0761463 1.16676
-0.0371061 0.253874 -0.146159
0.324922 0.43083 0.754176
-0.0706248 0.249384 -0.283197
0.0225148 0.0386834 0.582029
0.22144 0.151779 1.45896
0.952287 1.33495 0.713352
Putting it all together
The following code will reproduce all the above output:
//Load the 'tsmt' library
library tsmt;
//Get path to GAUSSHOME directory
path = getGAUSSHome();
//Add file name to path
fname = path $+ "examples/index.dat";
//Load all data from 'index.dat'
y = loadd(fname);
//Extract all observations from the 4th column of 'y'
y = y[.,4];
//Plot data
plotXY(seqa(1, 1, rows(y)), y);
//Transform data
Y = 100 * ln(Y[2:rows(Y)] ./ Y[1:rows(Y)-1]);
//Open new graphics window so we do not
//overwrite the previous graph
plotOpenWindow();
//Plot the transformed data
plotXY(seqa(1, 1, rows(Y)), Y);
//Declare 'gctl' to be a garchControl structure
//and fill with default values
struct garchControl gctl;
gctl = garchControlCreate();
//Declare 'gout' to be an garchEstimation structure,
//to hold the results from 'garch'
struct garchEstimation gout;
//Specify 'p' to equal 3
gctl.p = 3;
//Specify 'q' to equal 2
gctl.q = 2;
//Specify quasi-maximum likelihood standard errors
gctl.covType = 2;
//Perform estimation with 'garch'
gout = garch(gctl, y);
print "AIC                         " gout.aic;
print "BIC                         " gout.bic;
print "Likelihood ratio statistic  " gout.lrs;
//Extract parameter values
p_vals = pvGetParVector(gout.par);

//Extract parameter names
p_names = pvGetParNames(gout.par);

//Create 1x4 string array with the header information,
//using the horizontal string concatenation operator, $~.
head =  "" $~ "Coefficients" $~ "lower cl" $~ "upper cl";

//Create a 'number of parameters' x 4 string array containing
//the parameter estimates and confidence intervals
body = p_names $~ ntos(p_vals ~ gout.climits);

//Print report
print head;
print body;
//The standard errors of the parameters are
//equal to the square root of the diagonal of the 'moment' member
std_err = sqrt(diag(gout.moment));

//Calculate t-statistics
t_stat = p_vals ./ std_err;

//Create header string using horizontal
//string concatenation operator
head = "Parameters" $~ "Std. Err" $~ "T-stat";

//Create data table by:
//   1) Concatenating each vector with the ~ operator
//   2) Converting the matrix to a string with 'ntos'
data_tbl = ntos(p_vals ~ std_err ~ t_stat);

//Print the output
print "";
print head;
print data_tbl;