
Introduction
This example follows the empirical example found in Hansen (1996) and estimates a threshold model for quarterly GNP growth rates. The data file "gnp.dat" contains seasonable adjusted GNP for 1947 to 1990 and is transformed into annualized quarterly growth rates.
Load data
This example loads the data using the GAUSS function loadd. The function loadd utilizes the GAUSS formula string syntax and allows users to load and transform specific variables directly from the dataset.
new;
library tsmt;

/*
** Real GNP data
** Seasonally adjusted and transformed in annualized quarterly growth rates
** 1947-1990
*/

// Load 'real_gnp' variable and perform 'ln' transformation
dataset = getGAUSSHome() $+ "pkgs/tsmt/examples/gnp_4790.csv";
ln_gnp = loadd(dataset, "ln(real_gnp)");

y = (ln_gnp[2:rows(ln_gnp)] - ln_gnp[1:rows(ln_gnp)-1]) * 400;
Set Up the Estimation
The tarControl structure is used to control the model characteristics. This includes the number of lags considered, which lags to omit from the test, the number of replications, and graph features:
// Declare the structure
struct tarControl t_ctl;

// Fill 't_ctl' with default settings
t_ctl = tarControlCreate();

// Maximum number of lags considered
t_ctl.p = 5;

// Lags to omit from the test
// Consider lags 1, 2 and 5
t_ctl.omit = { 3 4 };

// Number of replications for Monte Carlo
t_ctl.rep = 5000;

// Data start date and frequency
t_ctl.dstart = 1947;
t_ctl.freq = 4;
Estimate the Model
All output from the tarTest function can be stored in a tarOut output structure.
// Declare 't_out' to be a tarOut structure
// to hold the estimation results
struct tarOut t_out;

// Perform estimation
t_out = tarTest(y, t_ctl);
Output
The printed output from tarTest reads
OLS Estimation of Null Linear Model

        Variable         Estimate             S.E.
               C       1.99225488       0.59341810
          Y(t-1)       0.31753696       0.08929921
          Y(t-2)       0.13197878       0.08801236
          Y(t-5)      -0.08696297       0.06763670

Residual Variance         15.9605

Searching over Threshold Variable:              1
Searching over Threshold Variable:              2
Searching over Threshold Variable:              3
Global Estimates
Threshold Variable Lag          2.0000
Threshold Estimate          0.0126
Error Variance             14.5484

Regime 1: Y(t-2) < 0.012572

        Variable         Estimate             S.E.
               C      -3.21255539       2.12039565
          Y(t-1)       0.51278104       0.24699822
          Y(t-2)      -0.92692272       0.30831951
          Y(t-5)       0.38445656       0.24603002

Regime 1 Error Variance           23.5331

Regime 2: Y(t-2) > 0.012572

        Variable         Estimate             S.E.
               C       2.14186153       0.77389336
          Y(t-1)       0.30085440       0.10132777
          Y(t-2)       0.18484356       0.10131018
          Y(t-5)      -0.15813482       0.07335517

Regime 2 Error Variance           12.1430

Test Statistics and Estimated Asymptotic P-Values

Robust LM Statistics
           SupLM      14.06847762       0.17300000
           ExpLM       3.96481133       0.16720000
           AveLM       4.68986250       0.29240000

Standard LM Statistics
          SupLMs      18.24477743       0.94920000
          ExpLMs       4.77627149       0.94760000
          AveLMs       4.57209118       0.88940000
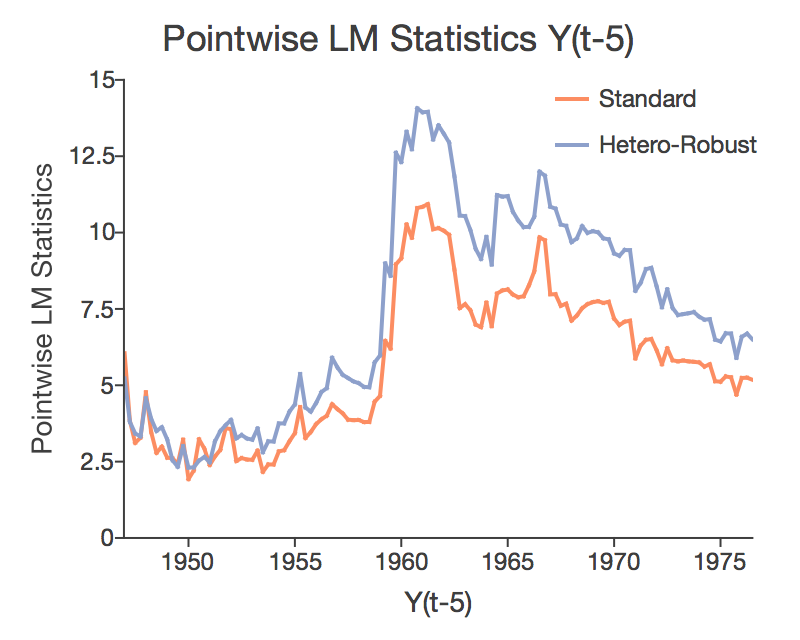
In addition, the procedure produces the graph at the top of this page and the two below.